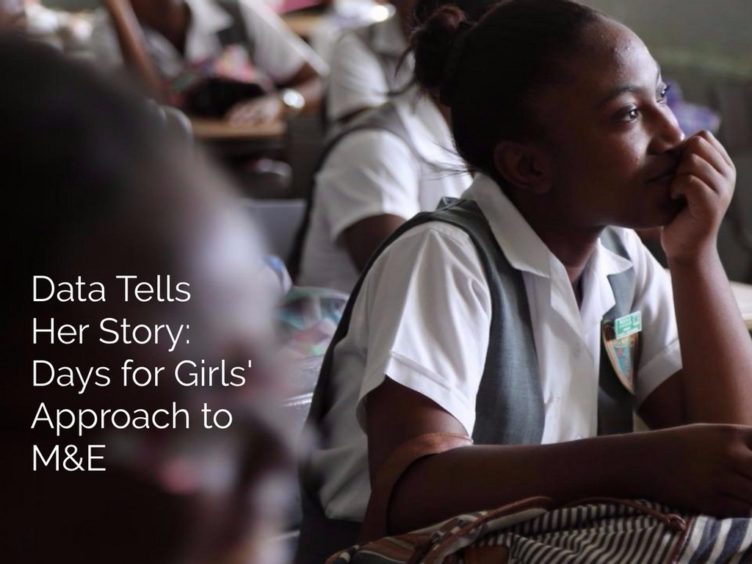
Data Tells Her Story: DfG Launches New M&E Toolkit

Days for Girls volunteers have captured the stories of women and girls and their struggles with menstruation all over the world. We read the stories that our Chapters bring back from Swaziland, Kiribati, and Honduras. We see it in the photos of girls receiving Kits in Malawi, Bangladesh, and Guyana. We experience it in the trainings in Uganda, Ghana, and Nepal. The challenge of menstrual hygiene is real.
Stories, pictures, and experiences are invaluable tools in helping others understand the gravity of this issue. But how can we really show how many and how much it affects them? How do we acknowledge the needs and experiences of women and girls around the world? How do we capture the scope of impact of our solutions? Or even measure how close we are to ‘Every girl. Everywhere. Period?'
We can tell people the price women pay for lack of adequate solutions is big. But when we share data like:
- One in ten girls in sub-Saharan Africa miss school each month due to menstruation.
- Or: On any given day, 800 million women and girls around the world are menstruating.
- 70% of girls surveyed in India had no idea what was happening to them when they first began their menstruation.
- Or: Chhaupadi research by Awon in Nepal found that 77% of girls and women practicing the tradition felt humiliated during their periods, and two-thirds reported feeling lonely and scared when staying in cowsheds in Nepal.
Those statistics provide clear evidence for why menstruation is a problem worth solving, and clearly demonstrate the magnitude of the problem. Data is a powerful tool in telling stories and sparking people to action. That’s why we’re launching a new Monitoring & Evaluation system to help capture their story and the impact of Days for Girls around the globe!
We’re Ready to Listen
For the past 7 months, the Days for Girls team has been hard at work on a new set of Monitoring & Evaluation (M&E) tools that will capture essential information on the impact of DfG Kits & education around the globe. These tools are available to all of our Chapters, Teams, Micro-Enterprises, Centers, and other partners, because every single person has a role to play in telling the story of the girls we reach, and data is a powerful way to do that.
But first, let’s break down what we mean by “monitoring” and what we mean by “evaluation.” Monitoring refers to the regular reporting on progress over time. This includes the number of DfG Kits distributed, the geographic areas reached, the number of girls and women trained with health education, and the numbers of people involved in DfG projects. So basically, monitoring refers to the cold hard facts! And the good news? This information is easy to collect… Count, fill in a form, you’re done!
Evaluation on the other hand refers to value of the solution, and the assessment of what the true impact really is. Sounds a little tougher? That’s because it is. Evaluation will help to measure those really important, but somewhat intangible questions like: what is the impact of menstruation on school attendance? What is the impact of menstrual hygiene on self esteem? In what ways does a DfG Kit change a girl’s life? These are the critical questions at the heart of everything we do. But there’s good news here too. By using a set of standard, simple questions, and asking these same questions to thousands and thousands of girls and women, we can begin chipping away at the real answers! And we’re confident that the Days for Girls network can do this. Why? Because there are over 60,000 dedicated individuals out there already doing this work, and the potential to collect a HUGE sample of data! The more data we get, the more confident we can be in our answers.
Let me give you an example. Let’s imagine I’m running a survey on ice cream. I have a hypothesis that everyone loves ice cream, but I need a survey to prove this. I ask two random people “do you like ice cream.” One person tells me yes, and one person tells me no. In conclusion, I can say that only 50% of people love ice cream. But wait a minute! How confident can I really be in that result? I only asked two people! Now let’s imagine I asked 10,000 people. 8,000 people told me they loved ice cream. Now I can be pretty confident that 80% of people love ice cream, because I have surveyed a huge number of people to get that answer. See? The more people we survey, the more confident we can be.
The same goes for our DfG Kits. With the power of 800+ Chapters and Teams, 5 Centers, hundreds of Micro-Enterprises, and countless partners, we have the power to tell one of the biggest stories in menstrual hygiene! If you fill out these simple forms every time you distribute DfG Kits, you will be changing the landscape of menstrual hygiene knowledge globally. You will be giving an incredible voice to the girls that we serve by telling their story, by providing evidence for their experiences. And all it takes is a few simple questions… 🙂
Now you can help show her story in an even bigger way with easy to use tools. Check out our new M&E tools here!


